The concept of excess capacity is found in the earlier works of Wicksell and Cairnes. P. Sraffa and Mrs. Joan Robinson also outlined it.
But it was Chamberlin who expounded it in a most systematic manner followed by Kaldor, Kahn, Harrod and Cassels.
The doctrine of excess (or unutilised) capacity is associated with monopolistic competition in the long- run and is defined as “the difference between ideal (optimum) output and the output actually attained in the long-run.”
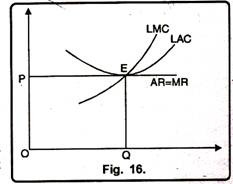
Under perfect competition, however, the demand curve (AR) is tangential to the long-run average cost curve (LAC) at its minimum point and conditions of full equilibrium are fulfilled: LMC = MR and AR (price) = Minimum LAC. This means that in the long-run the entry of new firms forces the existing firms to make the best use of their resources to produce at the point of lowest average total costs. At point E in Figure 16, abnormal profits will be competed away because MR = LMC = AR = LAC at its minimum point E and OQ will be the most efficient output which the society will be enjoying. This is the ideal or optimum output which firms produce in the long-run.
Under monopolistic competition the demand curve facing the individual firm is not horizontal as under perfect competition, but it is downward sloping. A downward sloping demand curve cannot be tangent to the LAC curve at its minimum point.
The double condition of equilibrium LMC = MR = AR (d) = Minimum LAC will not be fulfilled. The firms will, therefore, be of less than the optimum size even when they are earning normal profits. No firm will have the incentive to produce the ideal output, since any effort to produce more than the equilibrium output would involve a higher long-run marginal cost than marginal revenue.
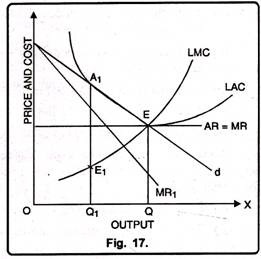
Thus each firm under monopolistic competition will be of less than the optimum size and work under excess capacity. This is illustrated in Figure 17 where the monopolistic competitive firm’s demand curve is d and MR1 is its corresponding marginal revenue curve. LAC and LMC are the long-run average cost and marginal cost curves.
ADVERTISEMENTS:
The firm is in equilibrium at E1 where the LMC curve cuts the MR1 curve from below and OQ1 output is set at the price Q1A1. OQ1 is the equilibrium output but not the ideal output because d is tangent to the LAC curve at A1 to the left of the minimum point E. Any effort on the part of the firm to produce beyond OQ1 will mean losses as beyond the equilibrium point E1, LMC > MR1. Thus the firm has negative excess capacity measured by OQ1 which it cannot utilize working under monopolistic competition.
A comparison of the equilibrium positions under monopolistic competition and perfect competition with the help of Figure 17 reveals that the output of a firm under monopolistic competition is smaller and the price of its product is higher than under perfect competition. The monopolistic competition output OQ1 is less than the perfectly competitive output OQ, and the monopolistic competitive price Q1A1 is higher than the competitive equilibrium price QE. This is because of the existence of excess capacity under monopolistic competition.

