The possibility of confounding, which is especially likely to occur in observational studies, usually needs to be considered when trying to interpret associations between exposures and diseases. A confounding variable is a variable that (a) alters the risk of the disease or condition under study independent of the exposure or characteristic of primary interest, and (b) is associated with the exposure or characteristic of primary interest in the study population, but (c) is not a consequence of that exposure. Suppose that an investigator finds that coffee drinking during pregnancy is associated with an increased risk for delivery of a low-birth-weight infant. The investigator would have to be concerned that this statistical association between coffee consumption and delivery of a low-birth-weight infant is actually attributable to a tendency of coffee drinkers to smoke cigarettes to a greater extent than non-coffee drinkers, and that it is the cigarette smoking that puts them at an elevated risk for delivering a low-birth-weight infant, not the coffee drinking. In this instance, smoking is considered a confounding variable.
With any study design, information on potential confounding variables can be obtained during data collection and then controlled for in the statistical analysis. Alternatively, in cohort studies, one or more potential confounding variables may be taken into account in the study design by matching unexposed to exposed individuals on the potential confounding variable(s), which then must be taken into account in the statistical analysis by using stratification or regression methods. In case-control studies, controls may be matched to cases on one or more potential confounding variables, and the matching again taken into account in the analysis. It is possible to match roughly on certain variables in the study design and then control more tightly in the analysis. Measurement of potential confounding variables is highly important, because otherwise they cannot be adequately taken into account in the study design or analysis.
Effect Modification
Effect modification, also called statistical interaction, occurs when the magnitude of the association between one variable and another differs according to the level of a third variable. For instance, the association between obesity and risk for breast cancer varies according to whether a woman is premenopausal or postmenopausal. Among postmenopausal women, obese women are at elevated risk for breast cancer, while before menopause, obese women are not at increased risk for breast cancer and may even be at decreased risk compared to thin women. An area of considerable current interest is whether the effects on disease risk of certain environmental exposures and lifestyle factors are modified by a person’s genotype. For example, Hines et al. (2001) found that moderate alcohol drinkers as a group were at decreased risk for myocardial infarction compared to non-drinkers. However, an individual’s alcohol dehydrogenase type 3 (ADH3) genotype modified this association. Moderate alcohol drinkers who were homozygous for the slow-oxidizing ADH3 allele had greater high-density lipoprotein levels and a substantially decreased risk for myocardial infarction compared to moderate alcohol drinkers of other genotypes. In the statistical analysis, identification of effect modification involves comparing associations between exposures and diseases in subgroups of the population (e.g., in premenopausal vs. postmenopausal women; in those homozygous for the slow-oxidizing ADH3 allele vs. those of other genotypes).
Some Measures Of Association And Their Attributes
Relative Risk
In cohort studies, the strength of the association between a putative risk factor and a disease is often measured by what is called a relative risk (or more accurately, a rate ratio or risk ratio; a discussion of rate ratios and risk ratios is beyond the scope of this research paper). A relative risk is simply the risk (or incidence rate) of disease in one group (usually the exposed) divided by the risk (or incidence rate) of disease in another group (usually the unexposed). A relative risk (or, technically, a rate ratio) of 0.043/ 0.088 = 0.49 can be computed from Table 2, consistent with a beneficial effect of religiousness. Before reaching any conclusions, however, one would want to check for confounding by a variety of variables that are associated with religiousness and life expectancy, such as smoking habits, alcohol consumption, and many other attributes.
Odds Ratio
In case-control studies, risks and incidence rates usually cannot be determined because the investigator has selected the study population based on the presence or absence of disease and does not know disease frequency specifically in the exposed and unexposed. Therefore, relative risks cannot be computed. Rather, the odds ratio is calculated. In an unmatched case-control study, the odds ratio is estimated by the ratio of exposed to unexposed among cases divided by the ratio of exposed to unexposed among controls. In a case-control study in which controls are individually matched to cases, the odds ratio is estimated as the ratio of the number of case control pairs in which the case is exposed and not the control to the number of pairs in which the control is exposed and not the case. It can be shown that for all but the most common diseases (i.e., more than 10% of the exposed or unexposed population affected), the odds ratio is a good approximation to the relative risk and can be interpreted in a similar manner. In the case-control study described above of the association between smoking and lung cancer (Table 1), the odds ratio of
![]()
indicates that the odds of lung cancer in smokers is more than nine times that in nonsmokers. The odds ratio in the study mentioned previously of the association between phytoestrogen consumption and breast cancer was 1.0 for the highest quartile of consumption versus the lowest quartile, suggesting no association, either negative or positive, between phytoestrogen consumption and breast cancer.
Standardized Ratios
The standardized mortality ratio (SMR) and the standardized incidence ratio (SIR) are generally used when disease rates in the cohort under study are being compared to disease rates in a reference population, such as the general population of the geographic area from which the cohort was selected. The SMR (or SIR) is the ratio of observed number of deaths (or incident cases) in the cohort to the number of deaths (or incident cases) that would be expected, for example, on the basis of age and gender-specific death (or incidence) rates in the general population. The SIR of 1.85 (74 observed cases/39.9 expected cases) for lung cancer incidence in male Norwegian silicon carbide smelter workers (Romundstad et al., 2001) indicates that there are almost twice as many lung cancer cases among the smelter workers as would be expected based on the age and time-period-specific incidence rates in the male population of Norway.
Confidence Interval
A confidence interval should be presented along with estimates of the relative risk, odds ratio, or other parameter in order to give a range of plausible values for the parameter being estimated. A 95% confidence interval of 1.46–2.75 around a point estimate of relative risk of 2.00, for instance, indicates that a relative risk of less than 1.46 or greater than 2.75 can be ruled out at the 95% confidence level, and that a statistical test of any relative risk outside the interval would yield a probability value less than 0.05.
Attributable Fraction
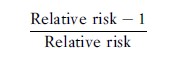
Provided that the association between a risk factor and a disease is causal (see the section titled ‘Guidelines for Assessing Causation from Observational Studies’ below), the attributable fraction provides a rough indication of the proportion of disease occurrence that potentially would be eliminated if exposure to the risk factor were prevented. It should not, however, be confused with the proportion of cases caused by the exposure or the probability of causation. The attributable fraction can be calculated either for exposed individuals only or for the population as a whole. In a cohort study, the attributable fraction for the exposed can be computed as
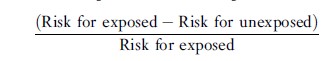
or, equivalently
The attributable fraction for the population can be computed as
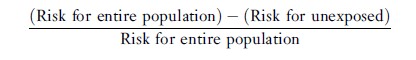
or, equivalently
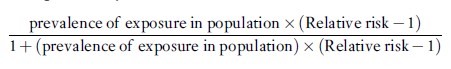
In case-control studies of uncommon diseases, the odds ratio can be substituted for the relative risk to provide a good approximation to the attributable fraction that would be computed using the relative risk.
It is important to note that in the presence of confounding, other formulae must be used to estimate attributable fractions.
Measurement Error
Inaccurate measurement can lead to erroneous conclusions. The possibility of measurement error is of concern for most variables considered in observational epidemiologic studies. Exposures such as diet and physical activity are almost always measured by questionnaire, and their measurement can entail a great deal of error. Measurement of some diseases such as arthritic disorders and psychiatric disorders is difficult because of the frequent absence of definitive diagnostic criteria.
The validity or accuracy of a measurement refers to the average closeness of the measurement to the true value. Reliability or reproducibility refers to the extent to which the same value of the measurement is obtained on the same occasion by the same observer, on multiple occasions by the same observer, or by different observers on the same occasion. Precision refers to the amount of variation around the measurement or estimate; a precise measure will have a small amount of variation around it, but may or may not be valid. Measurement error is said to be differential if the magnitude of error for one variable differs according to the actual value of other variables, and nondifferential if the magnitude or error in one variable does not vary according to the actual value of other variables. In a 2 ×2 table (e.g., exposure present or absent, disease present or absent), nondifferential misclassification always causes the relative risk or odds ratio to be closer to 1.0 than the true value, provided that errors in measurement of the two variables are independent. Dependent, or differential, misclassification, on the other hand, can cause associations to be overestimated or underestimated, depending on the circumstances.
When measurement error occurs for a potential confounding variable, adjusting for the confounding variable in the analysis will not entirely remove its effect. When both the exposure and confounder are measured with error, effects are less predictable. Also, when estimates are made from tables larger than 2×2, there are circumstances under which even nondifferential measurement error can cause an association to appear larger than it really is.