he Matrix Approach To Recognizing And Controlling Safety And Health Hazards
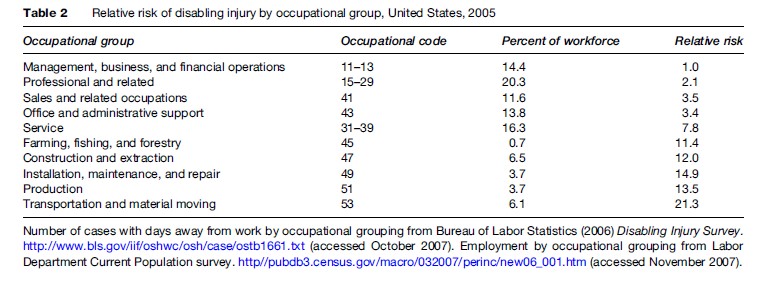
Relative risks of disabling occupational injury, stratified by occupational classification, are shown in Table 2. The rate of disabling injuries among material-moving workers is more than 20 times that of executives. Production workers, like assemblers and machine operators, suffer more than 10 times the disabling injury rate. Service workers suffer nearly 8 times the rate, clerical workers suffer 3 times the rate, and even professional workers suffer twice the rate as the executive reference group. These differences imply that any measurement of safety and health performance in a workplace has to take occupational mix into account.
In Figure 1 we illustrate a job–outcome matrix, a useful tool for analyzing health outcomes and job classes. This figure illustrates the combination for the manufacturing sector, but a similar matrix with perhaps different categories can be created for any industry sector. Similar matrices have been developed for jobs and exposures. Such matrices are regularly used in epidemiological occupational health studies.

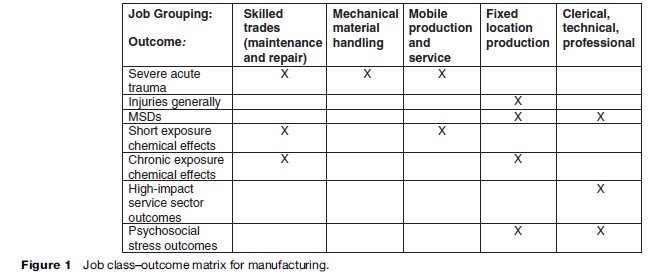
Because of the great utility of the matrix approach, we illustrate its application here with a manufacturing sector example. The example combines experience in a primarily transportation equipment and metalworking manufacturing environment with diverse other sectors where the workers were represented by a single trade union with an active health and safety program. This example provides a framework for analyses of other sectors, for which there is currently less practical experience that has been applied to the matrix model. The reader is referred elsewhere for fuller description of the processes and some of the outcomes in this sector (Mirer, 1998). The fatality data supporting these analyses have been collected and published as well (International Union, 2006), and in this research paper we link in, for the first time, the disability insurance data. We present the model on an outcome by outcome basis.
The model was framed by observations over many years of differential outcomes across job assignments. Specifically, the rate for fatal injuries was very elevated for the skilled trades (maintenance and repair workers) compared to production workers at fixed stations (assemblers and machine operators). This differential risk was a major driving force in prevention programs over decades.
We now proceed to illustrate prevention programs for various outcomes: fatal or severe acute injuries; injuries generally; musculoskeletal disorders; short-onset short duration chemical exposure effects; chronic exposure chemical effects; high-risk service sector outcomes; and outcomes from work-related psychosocial stress.
Outcome: Fatal Or Severe Acute Injuries
Table 3 presents proportions of fatal injuries over a 23-year period, stratified on selected exposure categories. We estimate that no more than 20% of hourly workers are skilled trades. Since 41% of fatalities were skilled trades workers, we calculate that the fatality risk is about fourfold compared to the rest of the hourly workforce.
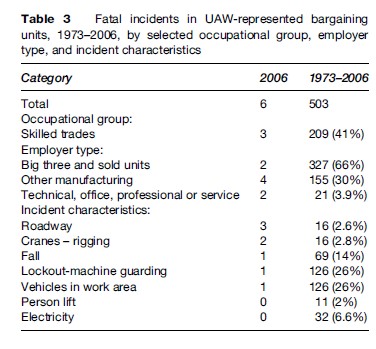
Skilled trades work involves installation, repair, and maintenance of machinery, equipment, and building structures, while production work does not. Thus, using a job-matrix approach, it makes sense that these work activities should be the focus for fatality prevention. Among the health and safety interventions carried out, an initial focus was energy lockout. Energy lockout encompasses shutting off the power to equipment (and also releasing stored energy) and then securing the energy sources with individually assigned locks (lockout process) before engaging in repair and maintenance activities. (Sometimes a less effective ‘tagout’ approach is used, in which the energy source is merely tagged to warn against its usage.) The energy lockout approach is described in the OSHA standard for control of hazardous energy (1910.147). After experience with systematic application of energy lockout, it has become clear that lockout should be an integral part of machine guarding and control circuitry, and it is now required by the OSHA machine guarding standard (1910.212) and the national electrical code (NFPA 79A).
Our analysis also shows that falls from heights to a lower level are another major cause of death. Here, gravity itself is the hazardous energy source. Unlike in the construction industry, there is no fall prevention standard for general industry. Therefore, it became necessary to develop and launch self-designed programs to prevent fall-related fatalities. The approach used was to blend fall arrest equipment with the higher-level control of workplace design. The program emphasized installation of guardrails on maintenance platforms. This approach specifies implementation of the OSHA standard for walking and working surfaces, and frames the new ANSI standards for fall-prevention programs. The ANSI standard is an example of how preventive approaches for one sector can be generalized to other at-risk employment sectors.
Other major sources of energy that must be controlled in order to prevent fatal injuries are material handling equipment like industrial trucks, cranes, and other vehicles in work areas. When a study was carried out in the automobile manufacturing industry, researchers found that obstructed aisles were strongly associated with increased collision risk (Collins et al., 1999). The industry formulated a program to clear the path of vehicle travel to prevent collisions.
In summary, fatality and serious injury risk is associated with maintenance, with work at nonstandard locations, and with mechanical material handling. The most fundamental corrective is to design and build production equipment and the environment to eliminate the problem. Designing for maintenance would also improve reliability of production and reduce downtime and waste. Effective design for maintenance will depend on involvement of employees, who will eventually maintain and repair the equipment in the earliest parts of the design phase.
Outcome: Injuries In General
The dominant measure of health and safety program effectiveness in a facility is the injury-illness incidence rate, measured either as total cases or as cases resulting in disability. Figure 2 illustrates the experience in the motor vehicle assembly sector in the United States, and illustrates the importance to prevention of complete injury and illness reporting.
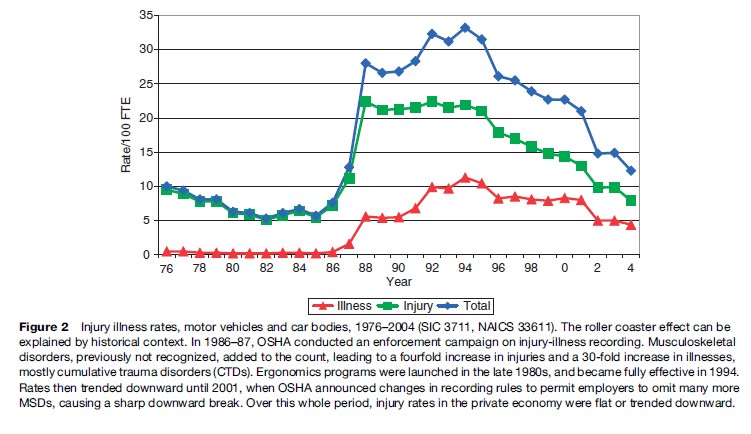
The general injury and illness incidence rate in this sector, as reported by the BLS, was slowly trending down, as was the rate for all private employment from 1976 to 1986. From 1986 to 1994, however, there were steep increases in the recorded rates, with a six fold increase in the overall rate, a fourfold increase in the injury-only rate, and greater than a 30-fold increase in the ‘illness’ rate. Then, from 1994, rates trended down again. By 2005, there was a threefold decrease. Similar but less dramatic time trends were observed in motor vehicle parts and related sectors. Meanwhile, the time trends in the rest of private employment were trending down a few percent.
The changes in the various reported rates can be explained by events in the health and safety environment. From 1986 through 1990, OSHA vigorously enforced injury and illness recording requirements, particularly in large facilities in the manufacturing industry, focusing on meat packing and the auto sector. This enforcement involved assessment of six-figure penalties for willfully not recording. One result of the OSHA enforcement program was that it was possible to determine what types of injuries were being underreported. The predominant cases not recorded in the OSHA logs prior to the enforcement crackdown were musculoskeletal disorders (MSDs). Musculoskeletal disorders are defined by the U.S. Department of Labor as ‘‘an injury or disorder of the muscles, nerves, tendons, joints, cartilage, or spinal discs. MSDs do not include disorders caused by slips, trips, falls, motor vehicle accidents, or similar accidents. MSDs include sprain and strain injuries and disorders such as carpal tunnel syndrome’’. The events that cause these are overexertion and repetitive motion. Practitioners believe that many sprain or pain events are acute flareups of chronic conditions. The chronic conditions may arise from long-term repetitive exposures – such as kneeling at work eventually leading to an acute ‘knee sprain’ – or be sequels to a primary overexertion, such as a back injury.
The undercounting of MSDs was primarily identified when paid workers’ compensation claims were analyzed in comparison to the OSHA-required data on occupational injuries. All paid workers’ compensation cases, of course, have an implicit recognition of the work relatedness of the injury; they almost always involve time lost from work and thus should appear in the OSHA data, but few of these cases were recorded in the OSHA-required database.
The observations that musculoskeletal disorders were the most common cause of injury triggered participatory ergonomics programs at every unionized facility in this sector. These programs became fully effective around 1994 and it is very likely that some of the upward trend in the data shown, up to the year 1994, was the combined result of better recognition of MSDs as work-related and of better recording of incident cases. The decreasing trends that are observed in Figure 2 are almost certainly a reflection of the abatement of risk factors for musculoskeletal disorders that also followed the development of the ergonomic programs in the industry. The ergonomics programs continued to mature and dominate the reported injuries trend until 2001. In 2001, OSHA changed the recording rules to permit employers to omit recording of previously recordable injuries, and provided incentives to reduce recording by targeting inspections for workplaces that did record and report more injuries.
Outcome: Musculoskeletal Disorders
Once MSDs are recorded, it becomes clear that MSDs among production and service workers dominate the injury-illness rate in the motor vehicle sector and nearly every other sector of the economy.
The overall number of MSDs comes from a combined count of strain and sprain injuries and cumulative trauma disorders. The impact of MSDs arising from overexertion or repetitive motion on the overall injury rate can be inferred from the Bureau of Labor Statistics Disabling Injury Survey. These data are derived from a large sample of employer injury-illness records, coded by BLS for nature of injury, event or exposure, body part, and agent, stratified on industry and worker characteristics. Table 1 shows that in the motor vehicle manufacturing sector, 71% of disabling injuries are known to be MSDs. In virtually every other sector, the proportion of MSDs is 40% or greater.
A variety of MSD risk factor assessment checklists or simple calculation instruments based on the force-frequency-posture-duration paradigm are available for use by nonspecialist professional practitioners and lay job analysts. These include the NIOSH lifting guide (National Institute for Occupational Safety and Health, 1994), the Rapid Upper Limb Assessment Tool (McAtamney et al., 1993), and the ACGIH Hand Activity Level (Franzblau et al., 2005).
Elements of an effective ergonomics program include prospective job analysis, injury illness analysis, symptom surveys, reactive job analysis following identification of cases, risk factor abatement, reanalysis of abated jobs, worker training for participation in risk factor identification and participation in medical surveillance, and ongoing evaluation (National Institute for Occupational Safety and Health, 1997).
Job analysis for abatement at fixed workstations should also identify acute injury hazards, such as handling sharp objects, deficiencies in machine guarding, and the risk of hand tool use without appropriate fixtures for the work piece.
An example of a higher level of control is designing a product, such as a motor vehicle or significant home appliance, to encompass appropriate health and safety safeguards and features. Employees whose work involves using such a product should participate in redesign of the product, as well as in identifying hazards and recommending changes in workstations, work methods, and tooling.